
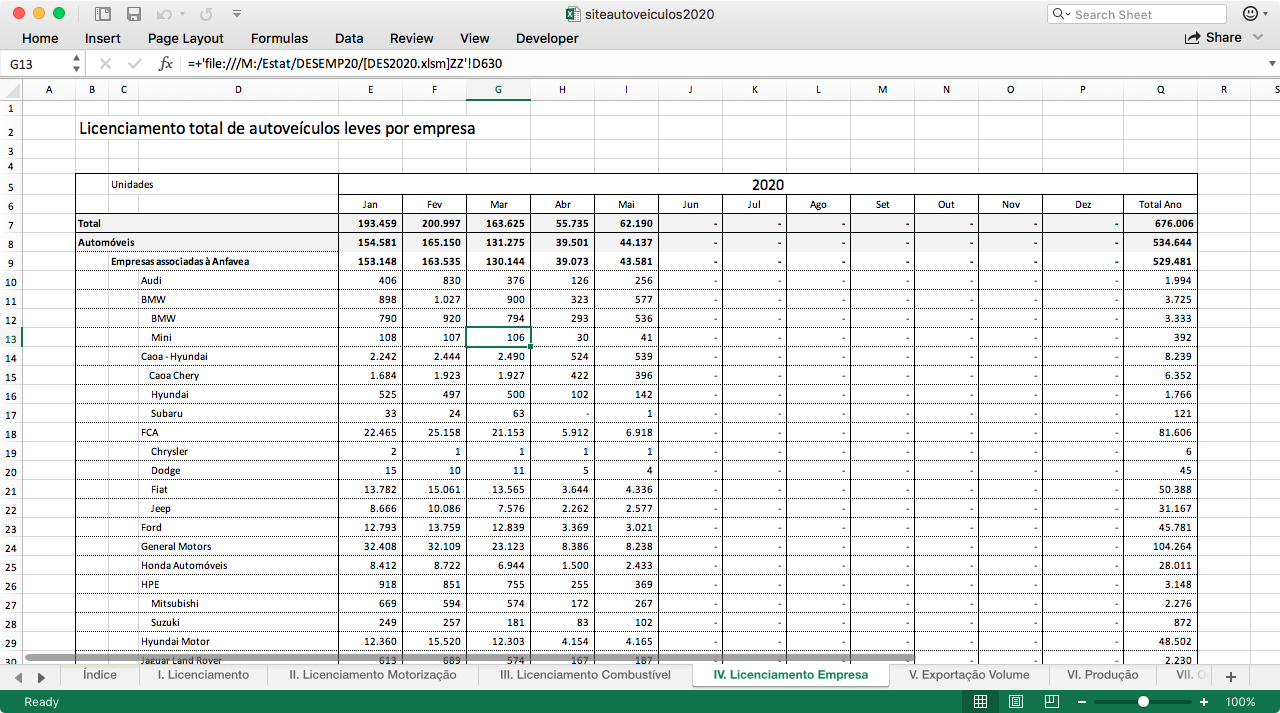
Anfavea, the National Association of Motor Vehicle Manufacturers in Brazil, discloses in its website some monthly statistics about the production and licensing of vehicles. People in the automotive market who use these data for analysis and forecast, certainly encountered various limitations in the Excel file available for download: the report looks like a PowerPoint presentation, with indented cells, values referring to subtotals in the middle of the lines and other small details that make it very difficult to use.
To make these data useful, I developed a Python script with a powerful analysis tool called Pandas, in order to be able to clean the original data and create a new Excel or CSV file.
The code is available on my Github repository.
OK, so now we have a new Excel file; but what about the possibility to create a Pivot Table and render it on this webpage to be able to filter the data, for example by segments (cars or trucks) ?
No problem, we can use the Free Web Pivot Table Tool from WebDataRocks to visualize it.
The code is very simple: as explained in their quick start guide, we define some Javascript to parse the data from the CSV file that we generated with our Python code and we render it.
<link href="https://cdn.webdatarocks.com/latest/webdatarocks.min.css" rel="stylesheet"/>
<script src="https://cdn.webdatarocks.com/latest/webdatarocks.toolbar.min.js"></script>
<script src="https://cdn.webdatarocks.com/latest/webdatarocks.js"></script>
<script>
var pivot = new WebDataRocks({
	container: "#wdr-component",
	toolbar: true,
    report: "/images/anfavea-report.json"
});
</script>
This is the result:
And what about the possibility to execute the script, obtain some reports and be able to interact with it (for example setting the year of the analysis) ?
I discovered that there is a tool that allows you to do that (Datapane), but it is no longer actively maintained.
Thomas Cenni